

It's been quite a while since I have written but I want to start writing again as it's something I enjoy. This financial checkpoint will be the same general format as the previous versions but keep in mind that I was divorced on April 15, 2024 so these figures are now just my own separate financials and the asset allocations are a bit different.
2025 has been quite an interesting year with Donald Trump taking office and implementing a slew of tariffs which rocked the stock market, leading to an 18.3% drop as measured by VTI (Total US Stock ETF) between February 19 to April 7, 2025.
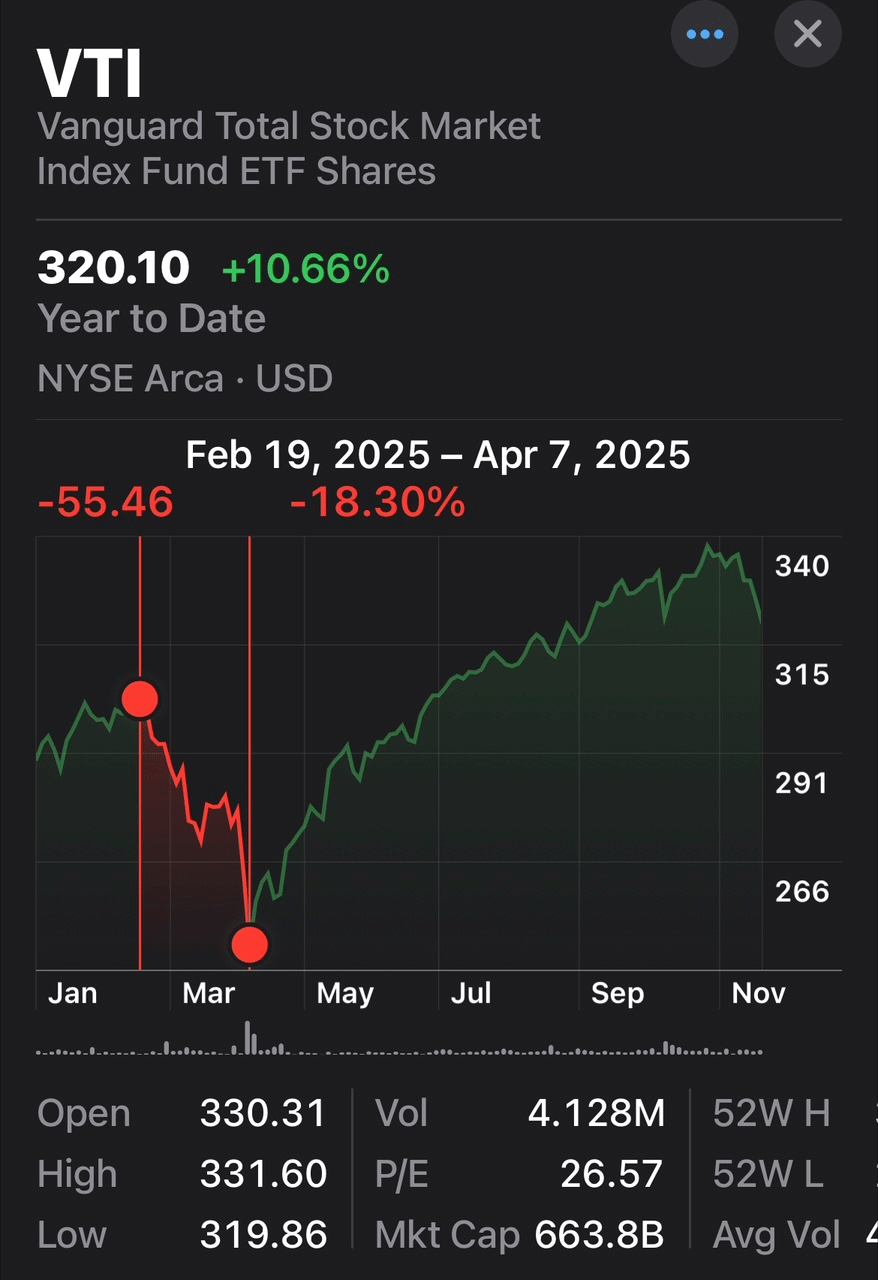
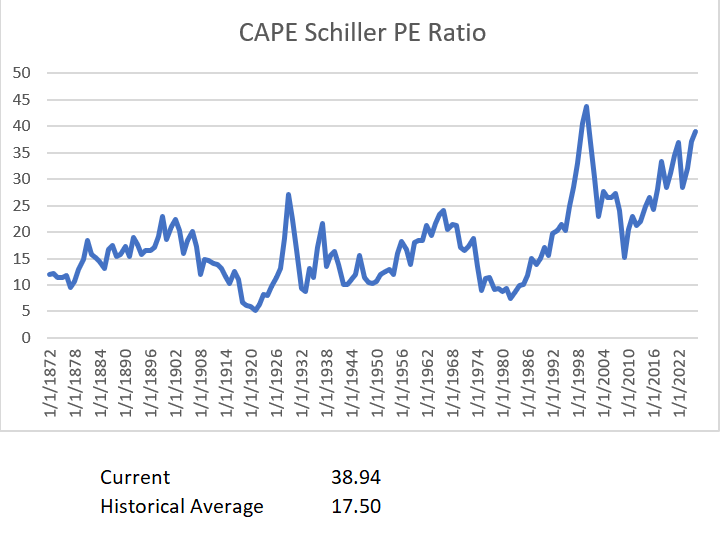
Fortunately, the market recovered quite rapidly and blew past the prior peak by June and kept going with tech stocks and particularly Artificial Intelligence (AI) stocks like Nvidia now reaching astronomical valuation levels. As of mid-November 2025, NVIDIA's trailing twelve-month (TTM) Price/Earnings ratio hovers around 52–53, based on recent stock prices near $181 and Earnings Per Share of about $3.50. While many believe AI valuations are justified, others fear a growing market bubble. For sure, the S&P 500 is at historically high levels based on the CAPE Shiller PE Ratio (Price Earnings ratio based on the average inflation-adjusted earnings from the previous 10 years) which is at 38.94 vs. the historical average of 17.50.
According to the Bureau of Labor Statistics, Inflation as measured by the Consumer Price Index for All Urban Consumers (CPI-U) increased 3 percent from September 2024 to September 2025. As of November 21, 2025, the national average 30-year fixed mortgage APR is 6.38% according to bankrate.com. Unemployment is at 4.4% based on the Bureau of Labor Statistics which is slightly up from 4.1% a year ago. I find it a bit challenging to assess real estate affordability but according to Longtermtrends.net, "Historically, a home in the US cost around 5 times the yearly median household income. However, during the housing bubble of 2006, this ratio exceeded 7." They further indicate "As of August 1, 2025, the US Home Price to Income Ratio is 7.03"
Overall, inflation seems to be under control and the economy appears fairly stable but stock market valuations and real estate affordability are historically high levels. This may mean subdued stock market returns and real estate appreciation in the next several years. However, with AI, robots, self driving cars, and spaceships now entering reality, its hard to predict what might happen going forwards.
Net Worth
I use Empower Personal Dashboard to track my Net Worth and I highly recommend using this powerful free tool. Unfortunately, it will only track my US accounts so I add my foreign accounts using excel. Since my divorce on April 15, 2024, I set a new baseline for my net worth budget target level which is the dotted line. This is the target I wanted to hit to have the annual spending budget I felt was most comfortable. However, I limit my spending budget to a 3.2% withdrawal rate based on my actual current net worth in any given year. The first Red Dot represents my personal net worth when I retired in September 2021 and the second red dot is when my divorce was finalized. Obviously, when I originally retired, the decision was based on the joint financial situation with my spouse. However, the figures below reflect just my own financials. Fortunately, the market has been quite positive in the last few years and I have now reached my target level.
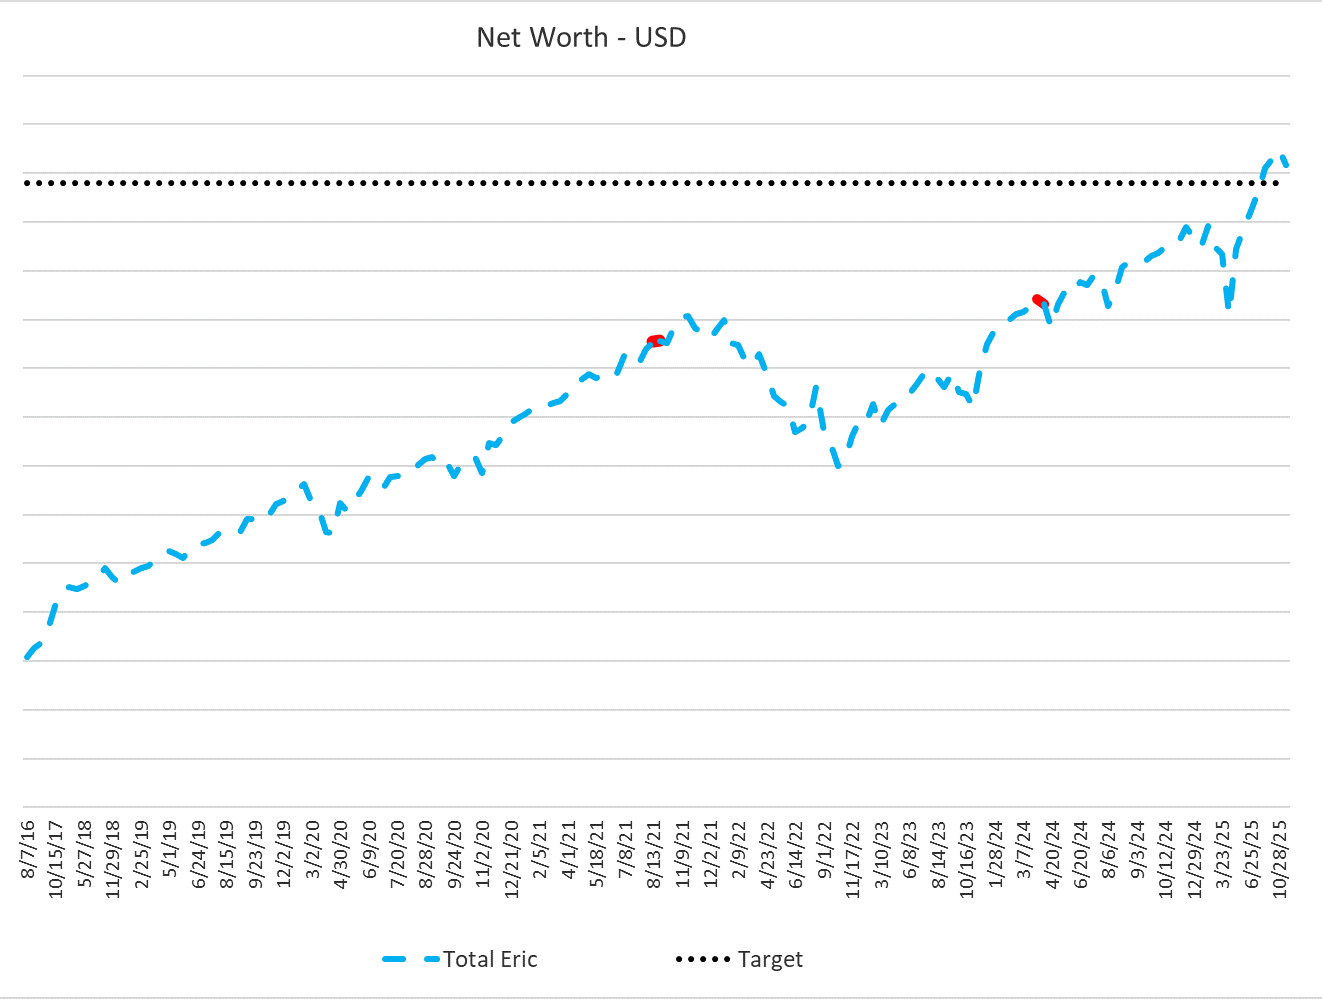
The 3.2% Safe Withdrawal rate was based on historical data going back to 1871 which includes periods such as the Great Depression. For more details on this, please see the article “How Much Is Enough for Early Retirement".
Going forwards, my Net Worth does not need to stay above the Target level and it is very likely it will dip below that level during my retirement. In fact, some of the historical scenarios in www.cfiresim.com show dips of 60% from the starting portfolio value based on my asset allocations.
Asset Allocation
In terms of Asset Allocation, I am still heavily weighted towards equities. The US Stock portion is primarily invested in the index fund VTI which tracks the Total US Stock Market. The International Stock portion is mostly VXUS (Total International Stock Market) and a smaller portion of IDV and VEOEY. The Alternatives are mostly VNQ (US Real Estate REIT ETF).
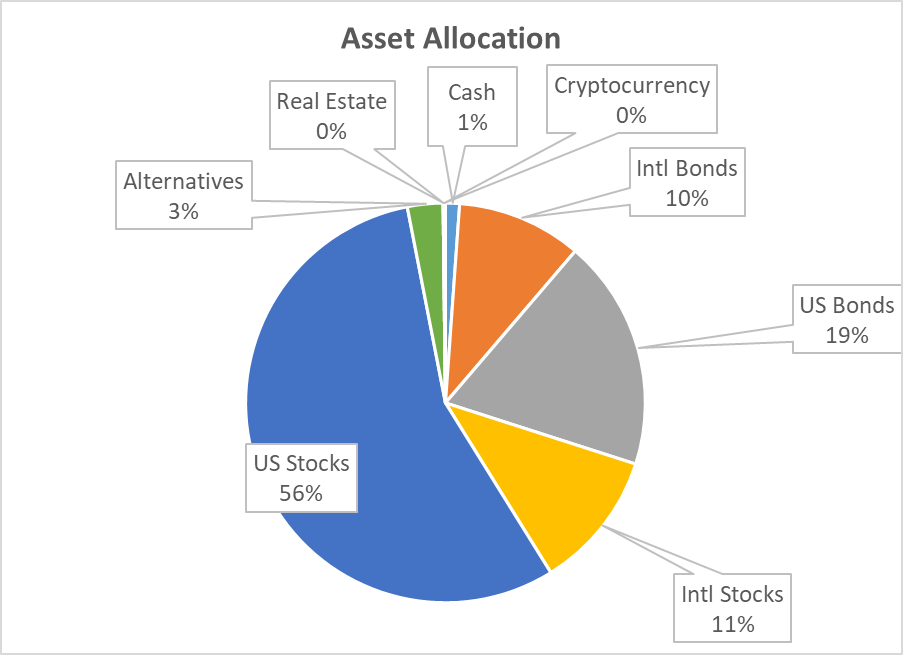
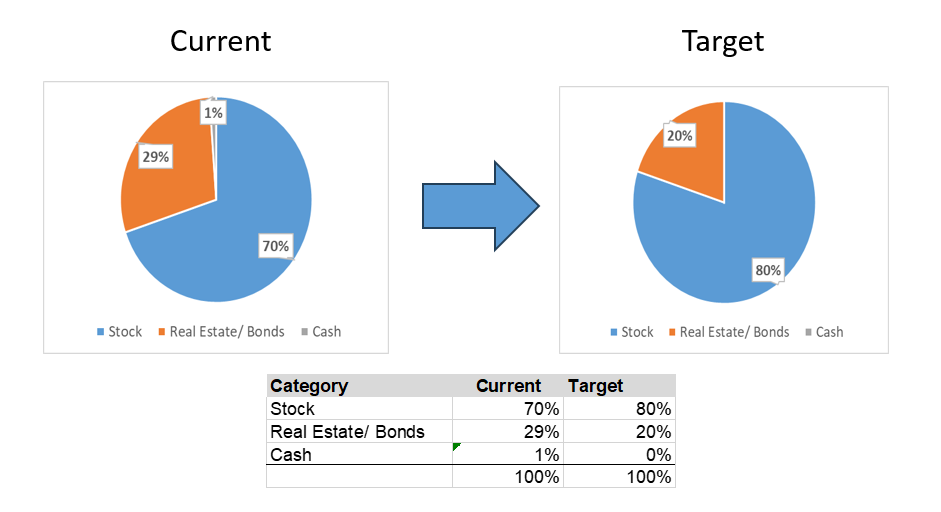
I find it helpful to look at the asset breakdown as shown in the pie chart below. For the last few years I had essentially 100% equities and no bonds at all since bonds were previously yielding almost nothing. Since stock valuations are now quite high and bond prices are near 10 year lows and yields are around 3.76-4.34% I shifted some money a couple months ago from my stocks to bonds (BND - Total US Bond ETF/ BNDX - Total International Bond ETF) to have essentially a 70% equities/30% bonds split. However I realized that, based on my historical analysis, I always want to keep at least 75% in stocks so I think I should target something closer to 80/20. Below is my actual stock/bond situation on the left vs. my target on the right.
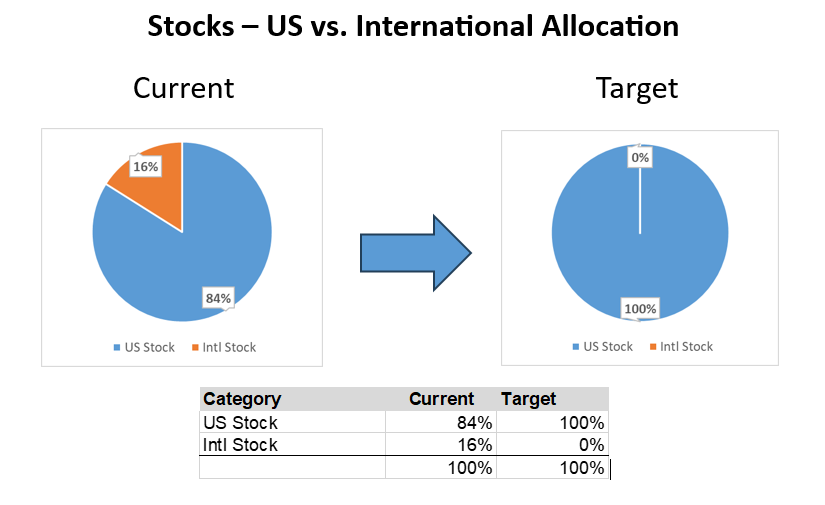
In terms of equities, I have deliberated quite a bit on US vs. International equities since US PE Ratios are quite high vs. other countries. However, the November 2025 Factset analysis continues to show that 42% of the S&P 500 company revenues come from outside the US so the S&P 500 is quite international. In addition, the correlation between US and International Stocks based on VTI (Total US Stock ETF) and VXUS (Total Ex-US Stock ETF) show a 0.85 correlation meaning the two assets move together most of the time with similar magnitudes indicating very limited diversification benefit. So, I am considering simplifying my portfolio to reduce or eliminate VXUS/ IDV.
Net Worth Check - OK
Asset Allocation - Reducing VXUS/IDV and Bonds. I plan to do this gradually. Ideally, I currently want to have 80% VTI and 20% BND/BNDX.
Budget
I was a bit concerned when I moved back to Manly, NSW, Australia since keeping my Budget in line while living in the Northern Beaches of Sydney is a bit challenging. However, I have been able to contain my costs fairly well and continue to do some consulting which I find enjoyable and which helps supplement my investment returns.
I use the Empower Personal Dashboard to track my Budget since it allows me to see all my credit card spending and bank account withdrawals all in one place. It is also easily downloadable into excel so I can analyze it. Unfortunately, I have to add in any spending from overseas accounts.
My spending by month is below. July was high because I purchased a used car (2005 BMW X3 E83). August was even higher due to Australia Tax payments and also travel costs.

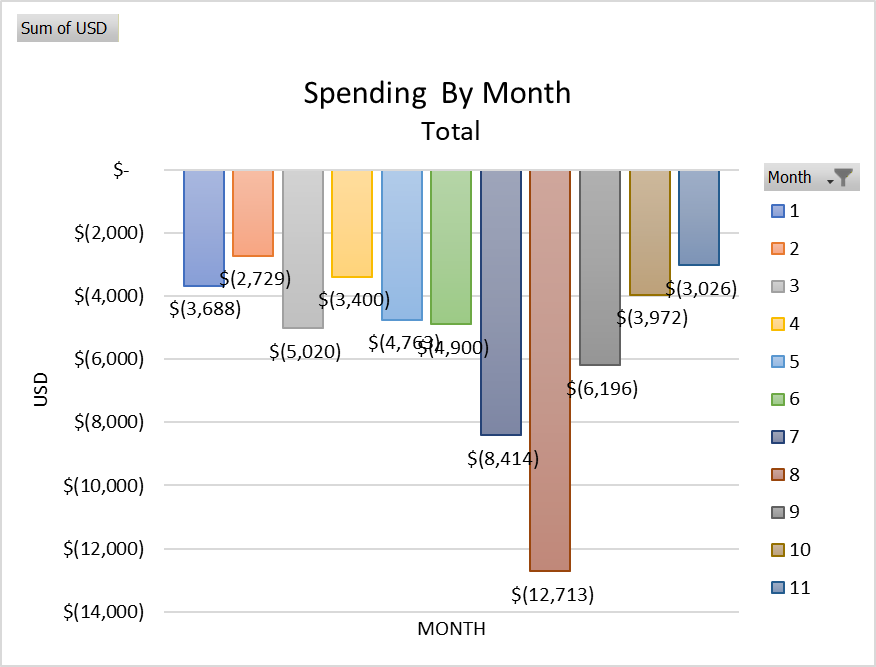
Year to date as of November 20th I have spent $58,820 USD and I am on track to spend about $66k USD ($100k AUD) by the end of the year which is within my 3.2% safe withdrawal rate.

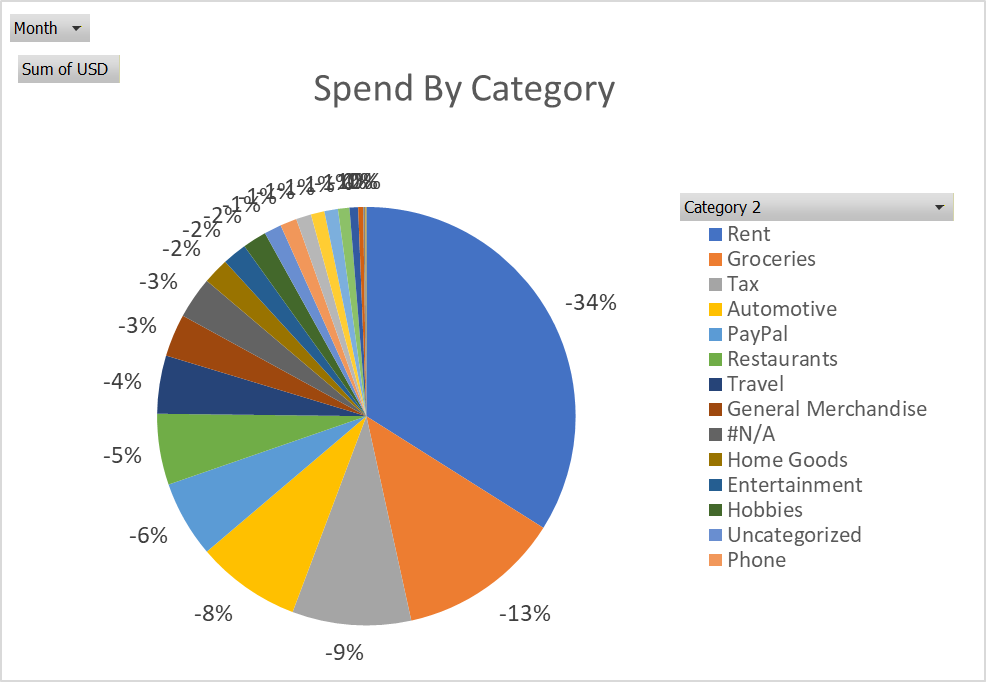
A breakdown of my spending categories is shown below:
Living Standards?
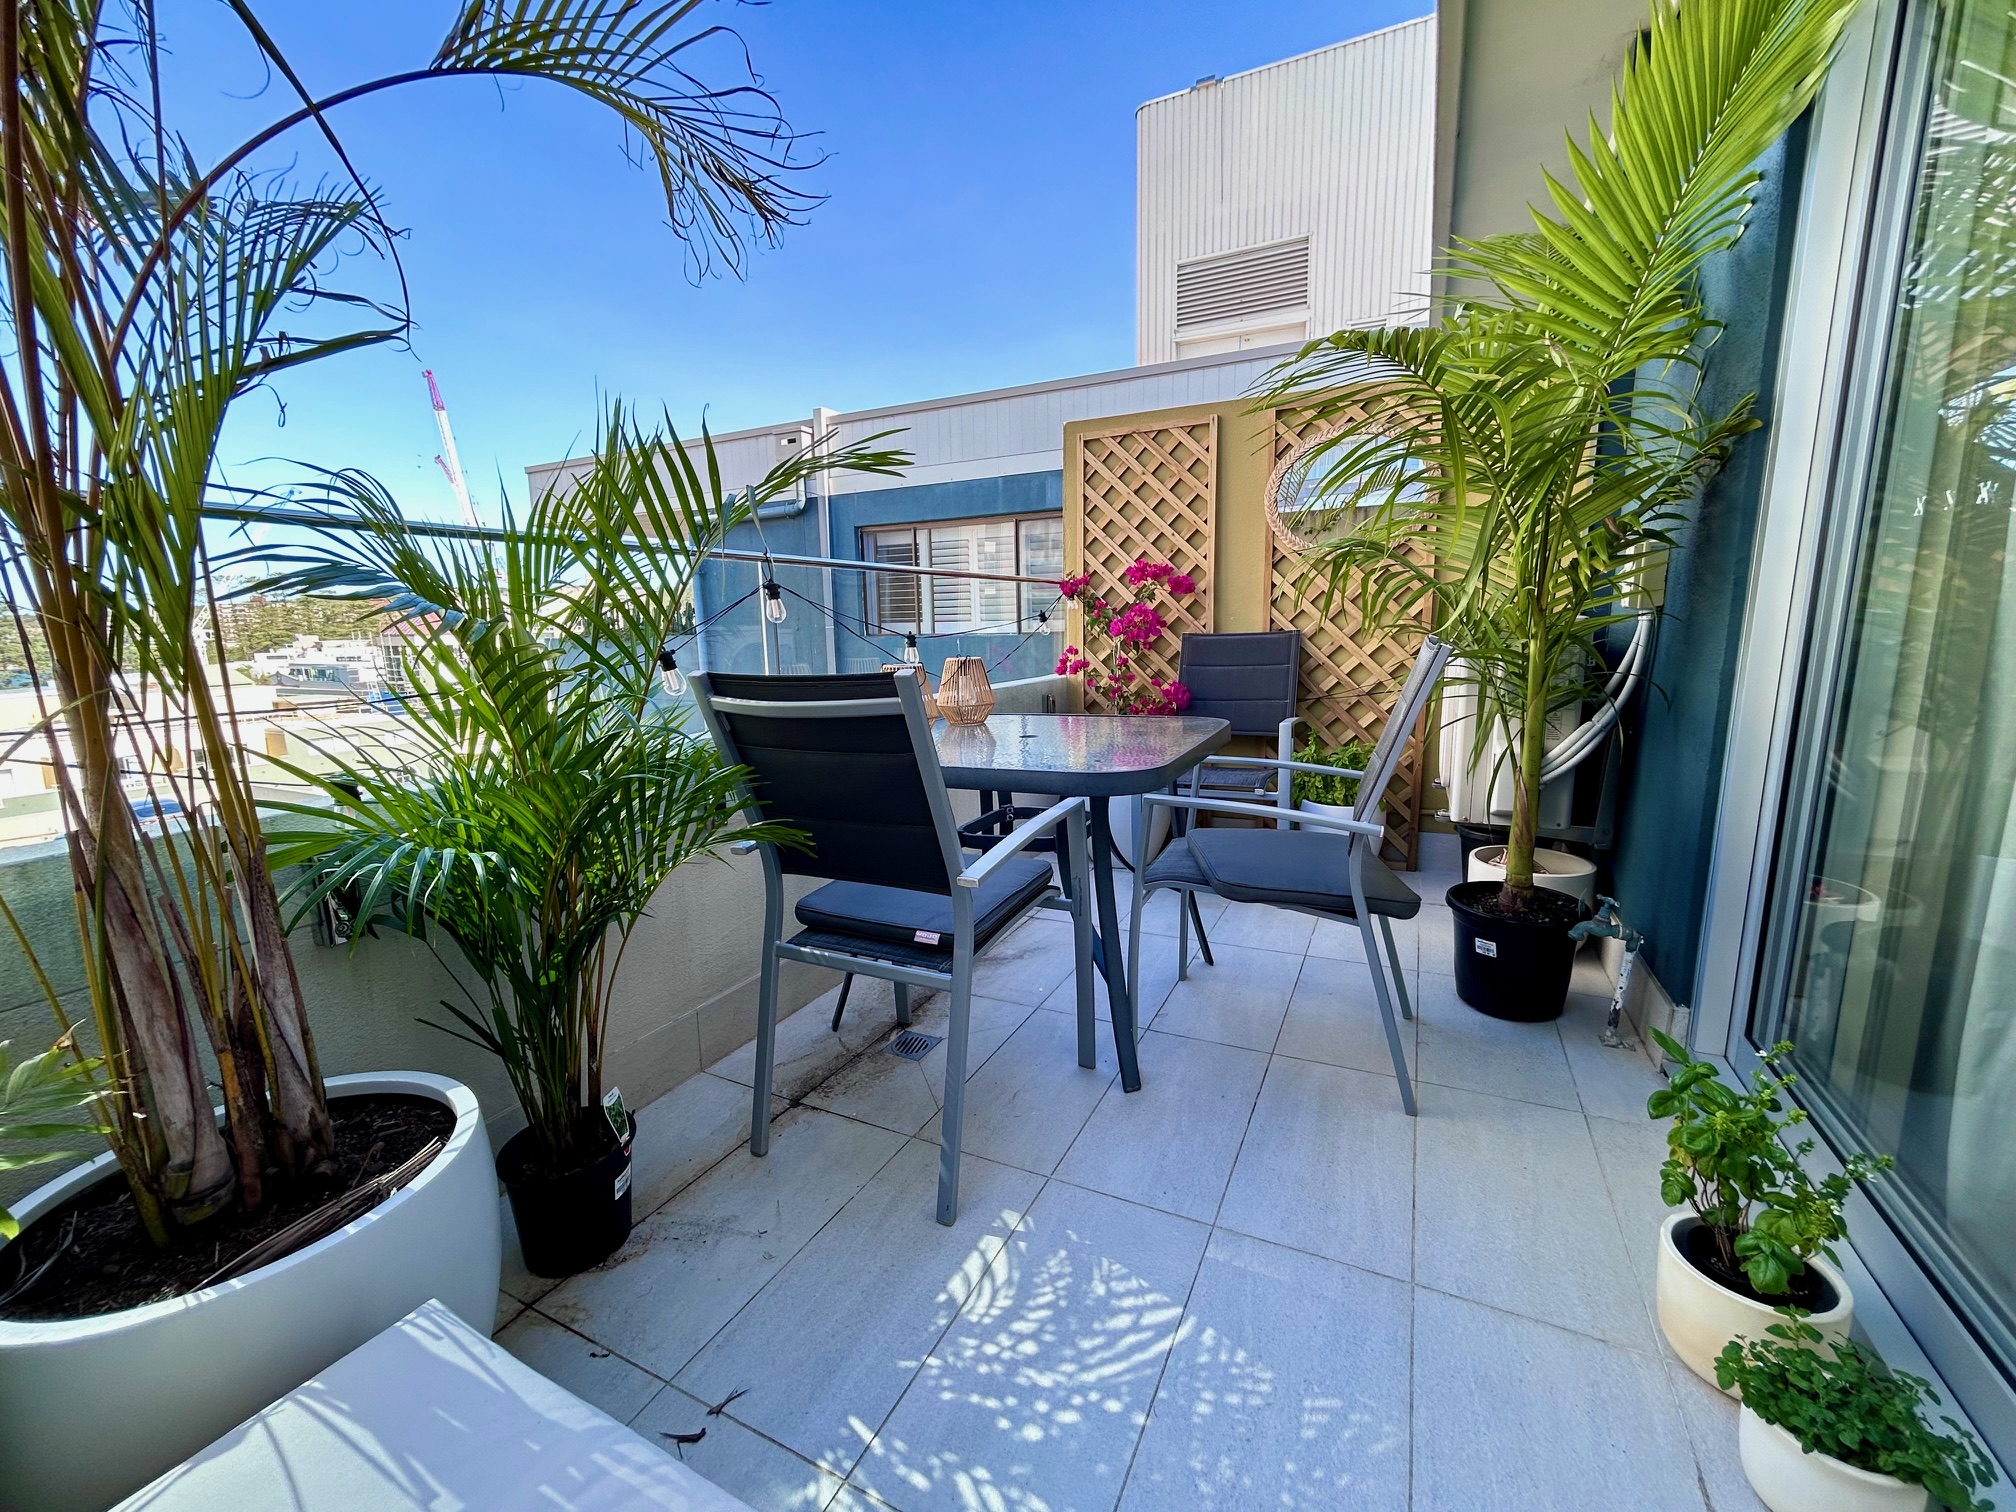
When people write this type of article for FIRE (Financial Independence/ Retire Early) I always wonder exactly what their living conditions look like. Above I show in detail the costs and that I am living on $66k USD ($100k AUD) per year but exactly what does that mean in terms of my lifestyle? Well, I live in a studio apartment in Manly, NSW and it costs me $580 AUD per week. It is a few blocks from the beach and here are some photos:

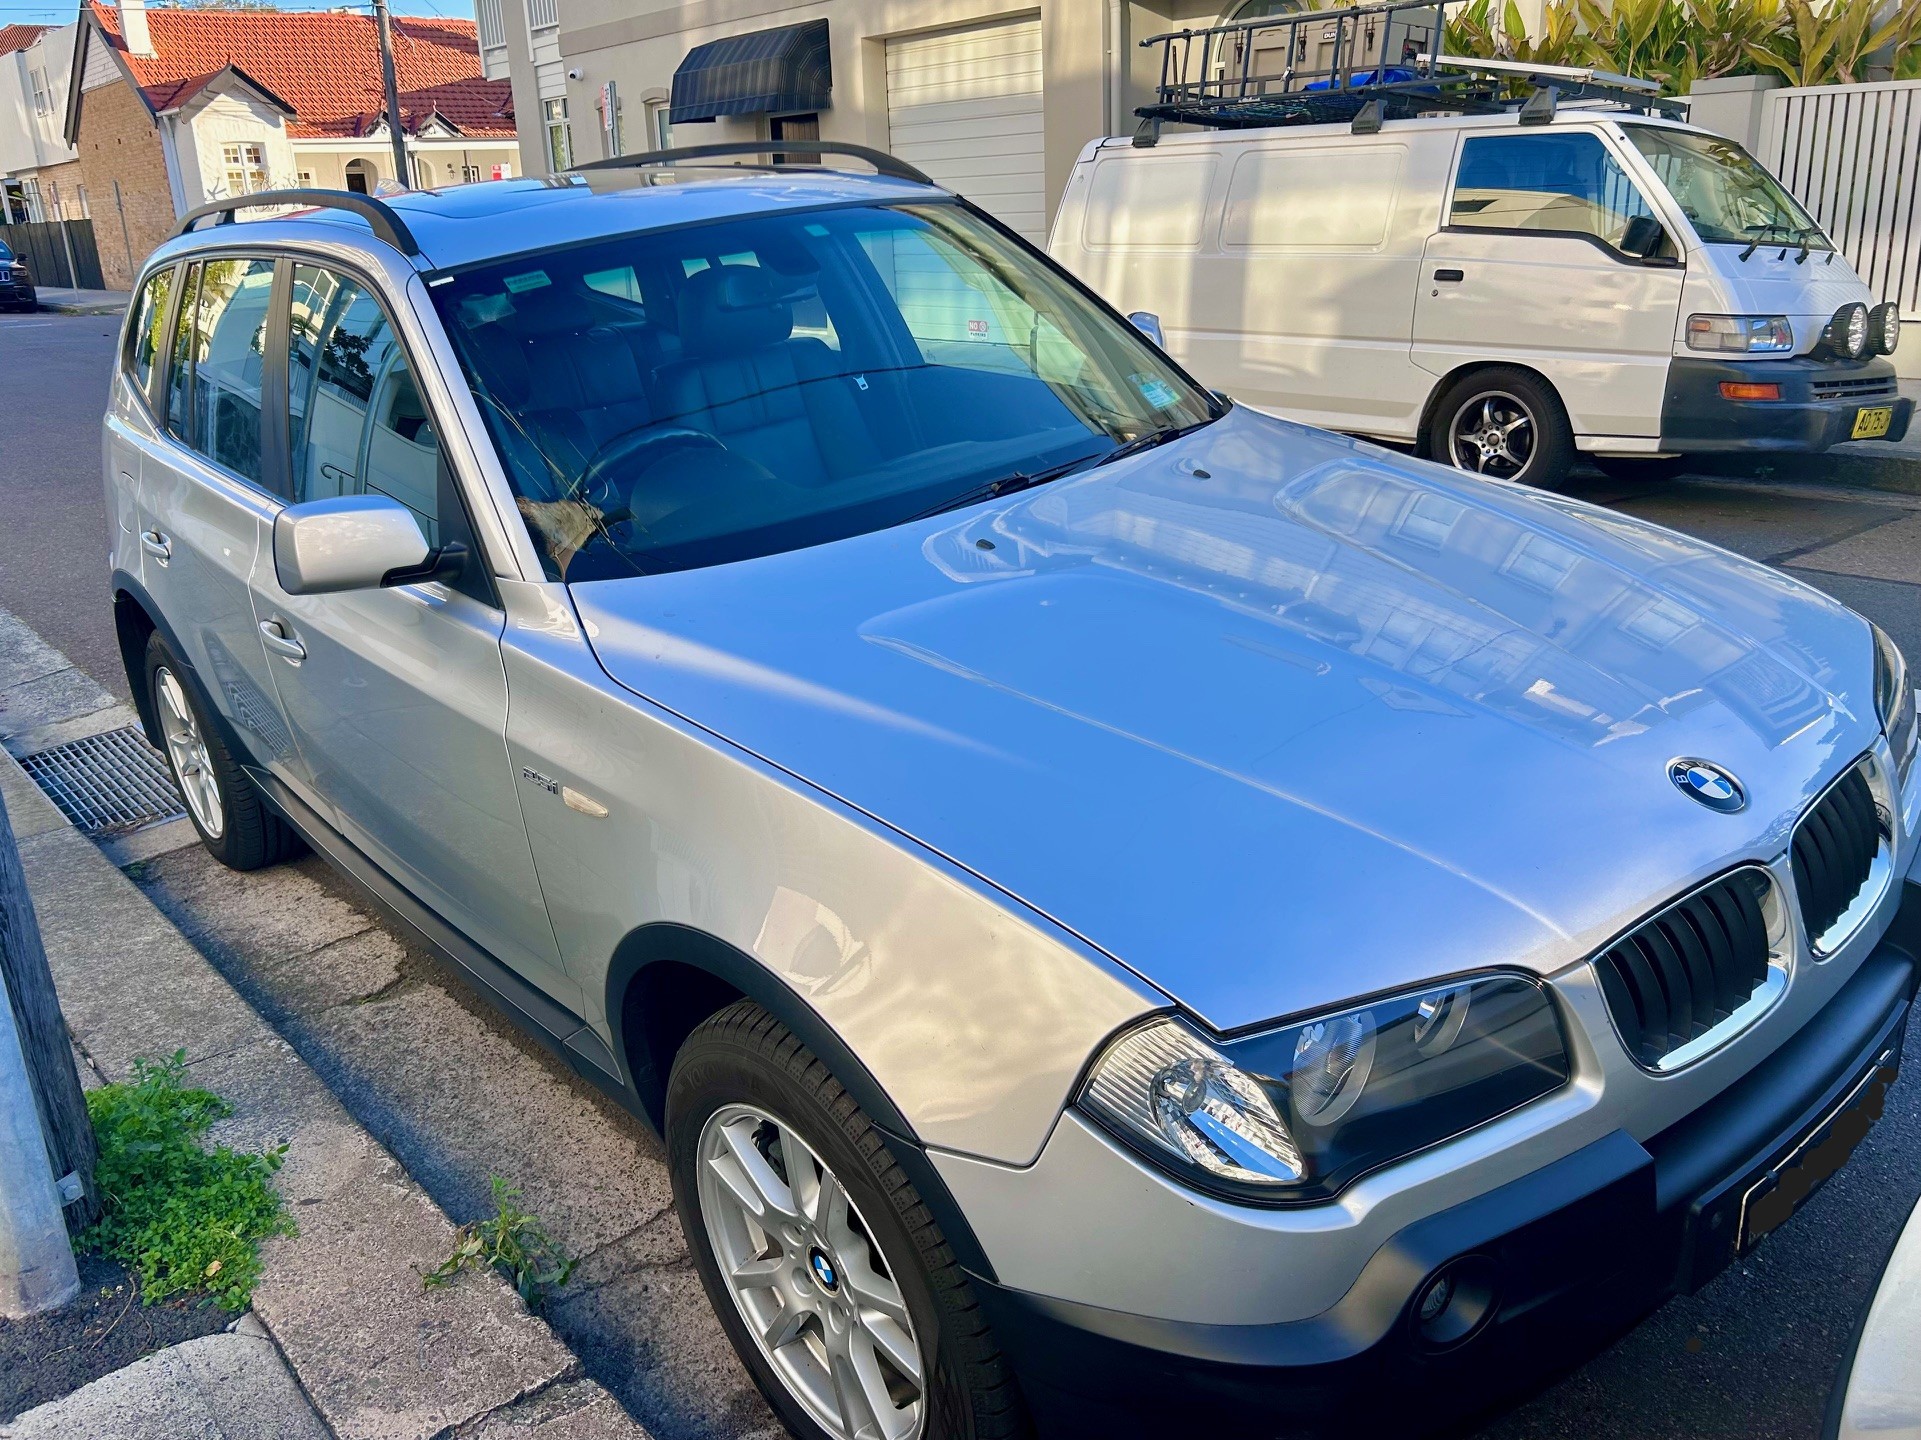
Until this year, I just used public transit which is quite good in Australia if you live near the city but is more challenging if you want to explore rural areas or beaches further away. So, I decided to buy a car and used Carsales.com.au. I found a 2005 BMW X3 E83 AWD 2.5L with 146,000km in good condition and ended up buying it for $5,500 AUD. The process was fairly simple but in Australia you need to buy Compulsory Third Party Insurance ($776.93 AUD/YR) which protects you financially if you injure someone and I also bought Third Party Property Only Insurance ($606.63 AUD/YR) which covers you if you damage their property. Here is a photo of my car:
Summary
In Summary, the Stock Market has performed exceptionally well lately, my budget is on track, and I am planning to shift my asset allocation to reduce International Equities and Bonds targeting something closer to 80% VTI/ 20% BND| BNDX. The income from my consulting company continues to keep my withdrawals well below my 3.2% SWR target.
I believe the market will continue to be volatile and challenging for the next few years. However, I feel good about my investments and spending and believe it's an exciting time to be alive. Tell me how your investing is going and if you have any tips or insights!
Update – December 31, 2025
Here is the final Full Year 2025 Spending up to December 31, 2025. I had previously estimated to spend $66k USD and ended up spending $67,741 USD which was mostly due to additional travel costs.
Metric |
Value (USD) |
| YTD Spend | $67,741 |
| Weeks (YTD) | 52 |
| Avg. USD/ Week | $1,303 |
| FY Total | $67,741 |
This is in line with my 3.2% withdrawal rate so I feel comfortable with this level of spending.

Glad you’re writing again! Great article!